The four numbers most dealerships review each month were built for a funnel that starts at the lead form. Here is how to measure the whole journey: five buckets on one dashboard, an attribution model you can act on, MER, and funnel velocity.
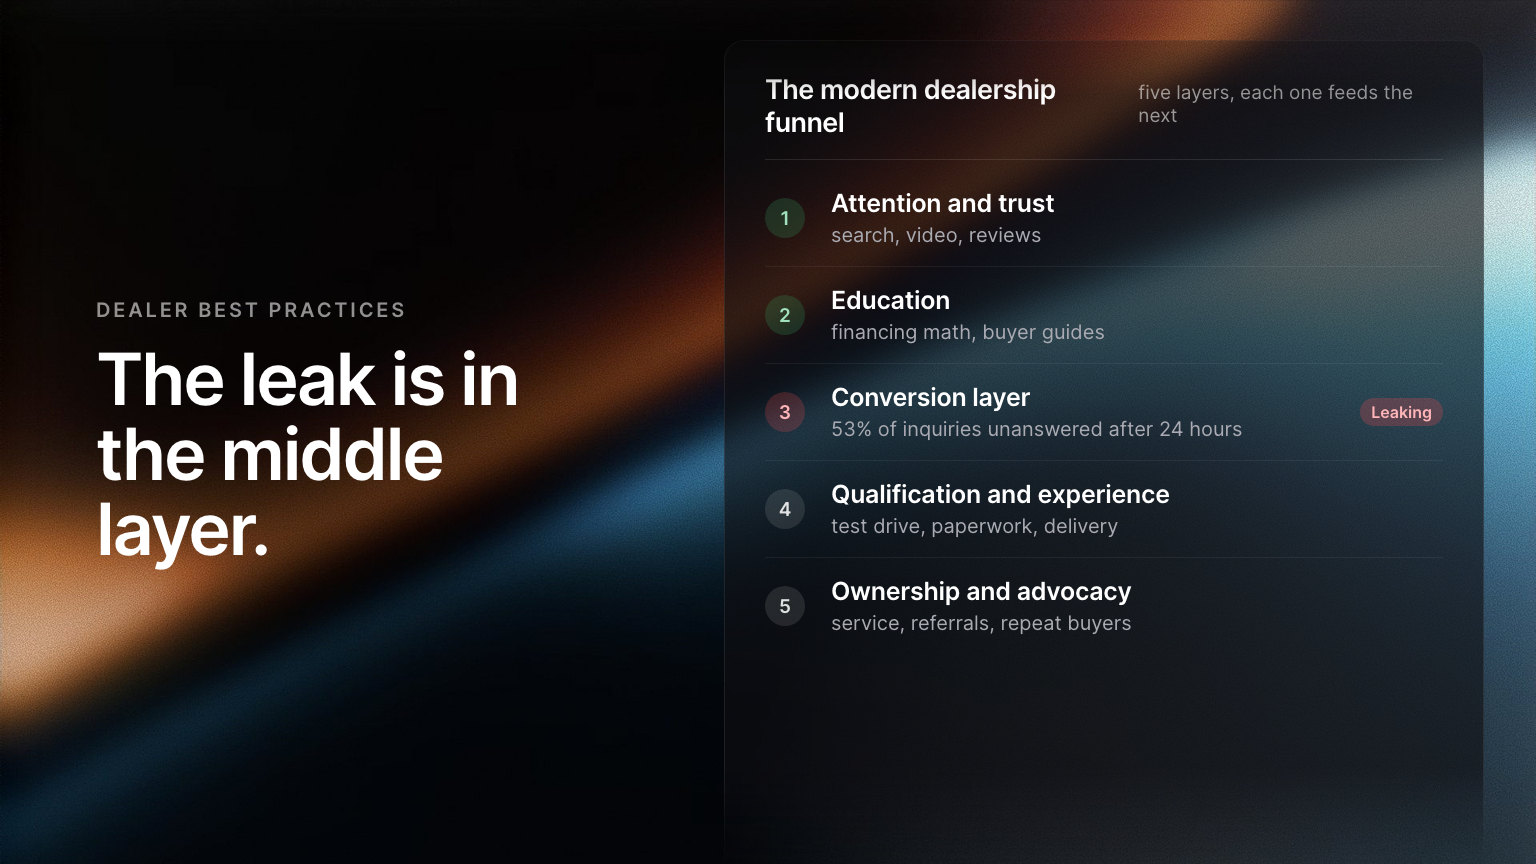
The modern dealership sales funnel has five layers, and the conversion layer in the middle decides most deals. Once a store runs that funnel, the next question is how to tell whether it works.
Many dealer groups answer it with a Google Analytics login, a few CRM reports, and a weekly look at the ad platforms. That gives them a lot of data and very little measurement. This piece covers what to put on the dashboard, how to think about attribution, and which numbers tell you early what next quarter will look like.
Why the old scoreboard misses most of the funnel
Most dealerships review four numbers each month: lead count, cost per lead, units sold, and closing rate. They are simple, they compare well across stores, and dealer groups have run on them for twenty years. They also assume a buyer who arrives at the lead form and leaves at delivery.
Today’s buyer touches the dealership many times before submitting a lead. A typical path: a YouTube review, an inventory page from a Google search, a retargeting ad, a few forum threads, a trade estimate on a third-party site, a social ad on the way home, a return visit to the inventory page on a phone at 10:47 p.m., and a lead from a laptop at 11:13 p.m.
The four-number scoreboard sees one of those steps, usually the lead form. It cannot tell you why traffic is up while sales are flat, which channel produced the sale, or whether the service department is costing you referrals. A store that can see only lead volume tends to buy more cheap leads and get soft appointments in return.
The fix is to count more signals. A return visit, a trade-tool start, a text at 9 p.m., and a repeat view of the same vehicle detail page (VDP) all count. A no-show counts against. Taken together, these signals show how fast buyers move through the funnel, as well as how many enter it.
Five buckets on one dashboard
The five layers of the funnel map to five measurement buckets.
Attention
Reach, sessions, impressions, branded search volume, Google Business Profile views, Maps direction requests, the organic-versus-paid mix, and video watch time. You need these, but alone they say little. If attention grows and conversion stays flat, the problem is further down the funnel.
Trust
Review response time, review velocity, review sentiment, staff-page visits, time on the financing page, returning-visitor rate, and lead-form response time. Few dealers track these, and they tend to move before sales do. When trust numbers slip, expect sales to soften later, even if traffic holds.
Engagement
VDP views, repeat VDP views, inventory search use, payment calculator starts, trade-tool starts, chat starts, click-to-call, click-to-text, and finance pre-qualification starts. A buyer who viewed one vehicle three times and started a payment calculation is a different prospect from one who left after a single page. Score them differently.
Conversion
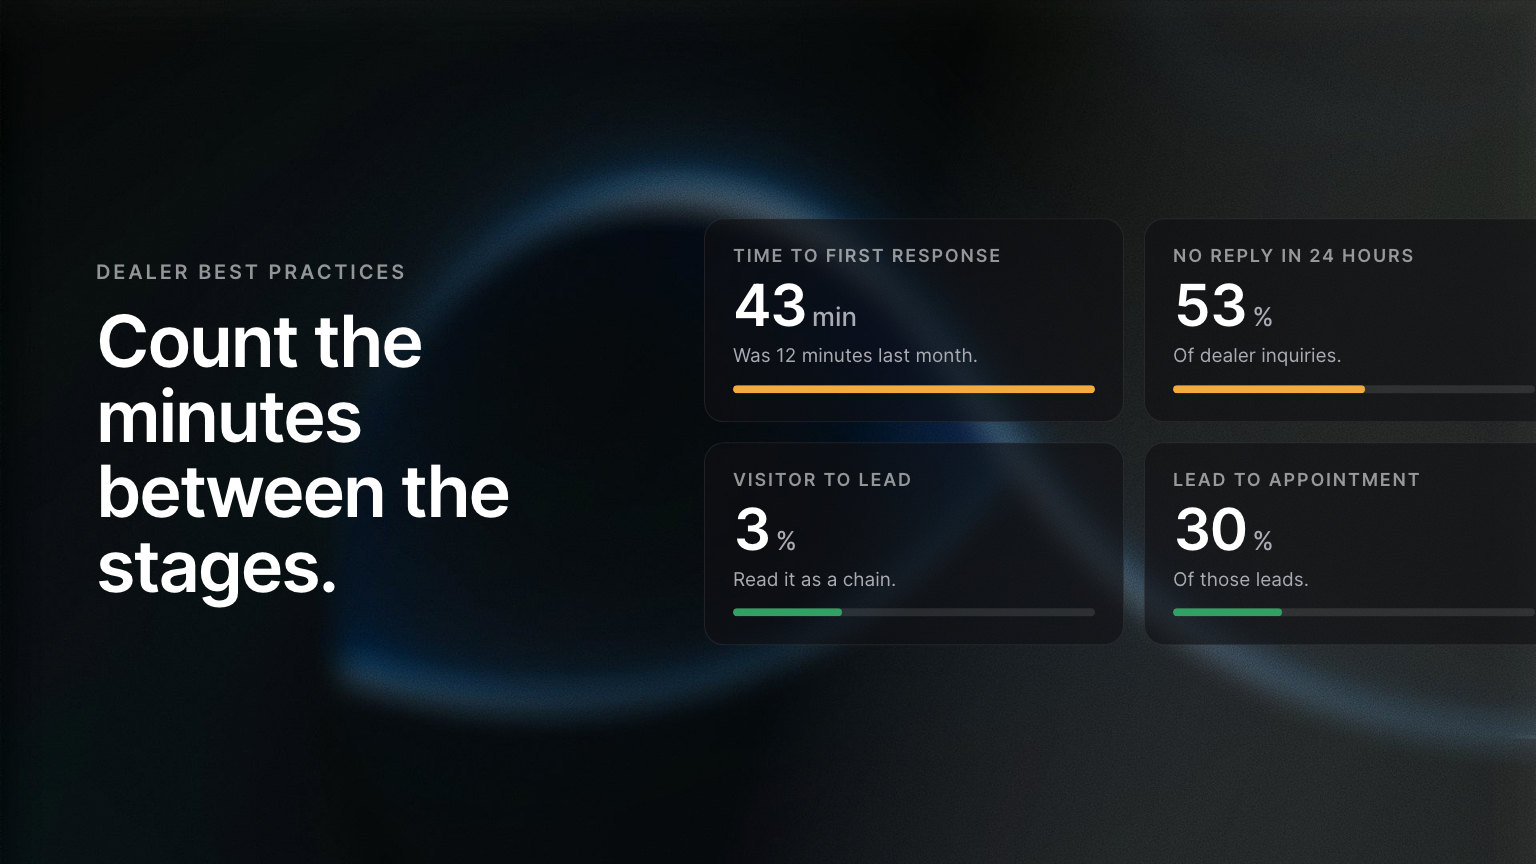
Visitor-to-lead, lead-to-appointment, appointment-to-show, show-to-sale, lead-to-sale, finance-application conversion, trade-appraisal conversion, and online purchase conversion. Most stores have these numbers but read them one at a time. Read them as a chain. A store at 3% visitor-to-lead and 30% lead-to-appointment has a different problem from a store at 1% and 70%, and it needs a different fix.
Experience and retention
Delivery satisfaction, follow-up consistency, sales CSI, service appointment availability, repair order turnaround, comeback rate, repeat purchase rate, accessory attachment, referral rate, review generation, and NPS. Much of what predicts next year’s sales sits in this bucket.
Attribution: choosing a model you can act on
The sale you closed last Tuesday almost certainly had more than one touchpoint. Asking which channel deserves the credit starts an argument. A better question is which way of assigning credit leads to better spending decisions next quarter.
First-touch attribution
First-touch gives the credit to the channel that introduced the buyer. It is useful for judging awareness channels: brand search, organic discovery, sponsored content, dealer events, and manufacturer referrals tend to score well. Used alone, it overvalues awareness and undervalues the work that closes deals, so stores that rely on it tend to overspend at the top of the funnel.
Last-touch attribution
Last-touch gives the credit to the channel just before the conversion. Most ad platforms default to it because it is the simplest to measure. It overvalues branded search, direct traffic, and retargeting. Stores that rely on it alone tend to cut the awareness spend that fed those conversions, and the pipeline thins out a few months later.
Multi-touch attribution
Multi-touch spreads the credit across the journey. A linear model gives every touch equal credit. A time-decay model gives more to the touches near the sale. A position-based (U-shaped) model gives more to the first and last touch. A data-driven model assigns credit from observed conversion patterns.
Multi-touch is more accurate, and it costs more in tools and in management time. A single rooftop rarely needs a full data-driven model, and a multi-store group usually does. For most stores, a time-decay or position-based model, with the CRM as the source of truth, is enough.
One buyer, many channels
Buyers use several channels at once: a few browser tabs, a YouTube video, a forum thread, and your Maps reviews while they wait for coffee. Any single-channel model will over-credit one of those and miss the pattern. The answer is identity resolution in the CRM, so that the same buyer’s web visit, ad click, call, text, and showroom visit all land on one record. Without it, multi-touch attribution does not have the data it needs, and every channel report disagrees with the others.
Marketing efficiency ratio (MER)
MER is total revenue divided by total marketing spend, across every channel, for a set period. It skips the channel-credit argument on purpose. If MER improves month over month, the marketing is working, whichever channel last-touch credits. If MER falls, something is wrong, even when every channel report shows a steady return on ad spend.
MER keeps the conversation at the P&L level, but it does not tell you which lever to pull. Put MER at the top of the dashboard, and use channel attribution to find the cause when it moves.
Funnel velocity
If you add one new metric to your monthly review, make it funnel velocity: how long a buyer takes to move from one stage to the next.
- Time to first response: from lead arrival to the first real reply.
- Time to appointment: from lead to a booked appointment.
- Time to show: from booking to the visit.
- Time to decision: from showroom visit to sale or no sale.
- Time to delivery: from sale to keys in hand.
- Time to first service, and time to second purchase.
Velocity matters for two reasons. A stage that slows down usually shows up later as lower conversion: if time to first response drifts from 12 minutes to 43, expect the month’s sales to fall short. And buyers feel velocity directly. They notice a store that moves fast, and it shows in reviews, referrals, and repeat business.
Response time is the stage with the most research behind it. A lead contacted within five minutes is 21 times more likely to qualify than one contacted after thirty minutes. Pied Piper’s 2026 study found that 53% of dealer inquiries got no response within 24 hours, and that fast-responding dealers sold about 50% more than the average.
A dashboard that fits on one screen
A monthly dashboard should fit on one screen and answer five questions, in this order:
- Is the top of the funnel healthy? Sessions, unique visitors, the organic-versus-paid split, branded search volume, Google Business Profile views, video views, and social reach.
- Is trust healthy? Review response time, review velocity, average rating, first-response time on lead forms, and returning-visitor rate.
- Is the conversion layer healthy? Visitor-to-lead, lead-to-appointment, appointment show rate, after-hours first-response rate, and no-show rate.
- Is the experience healthy? Lead-to-delivery time, sales CSI, delivery-day complaints, and post-delivery satisfaction.
- Is the P&L healthy? MER, cost per appointment, cost per sale, gross profit per delivery, service retention, and repeat purchase rate.
Give each row one owner, and flag it when it moves the wrong way. The dashboard should start a conversation every week and lead to one decision per row every month. Five rows that get that attention are worth more than an eighty-tile BI dashboard that nobody opens.
Handoffs between departments
Many dealer groups do not measure how well departments hand buyers to each other, and it is often the cheapest thing to fix. Useful measures:
- CRM completion rate
- Lead handoff accuracy from the BDC to the sales floor
- Whether the buyer met the service department on delivery day
- Service communication compliance
- Review request completion rate
- Feedback from sales to marketing on lead quality
- Parts and accessories attachment at delivery
A funnel moves at the speed of its slowest handoff. A store with good attention, trust, and conversion numbers but a broken handoff to service can have a strong quarter and a weak following year, because nobody started the retention work.
Getting the data to agree
Most dealerships already have the data: a CRM, website analytics, ad platforms, a review platform, a DMS, and a service scheduler. Each one reports a different number. Dealers who run this system on disconnected tools often give up after a quarter, because the numbers do not reconcile and the dashboard turns into a debate. Dealers who connect the data first, in-house, through an integrator, or with a partner, tend to keep going.
Ekho helps with the parts of the funnel it runs. The Ekho AI Sales Agent answers web chat and text leads in seconds, at any hour, and attaches the ad source and click to each lead it hands your team, so first-response time and source are recorded the same way every time. The Ekho Transaction Engine records an online deal from checkout through delivery, which makes lead-to-delivery time and cost per sale measurable for those sales. The free Ekho Website Grader is a quick place to start on the attention and trust rows.
What to do on Monday
The full system takes a quarter to build. The first step takes about two hours.
Export the last 90 days of leads from your CRM. For each lead, record the source, the first-response time, whether an appointment was set, whether the buyer showed, and whether they bought. Then calculate lead-to-appointment, show rate, and lead-to-sale, plus your median first-response time and your first-response rate for leads that came in after hours.
Many stores that do this for the first time find two surprises: the median first-response time is longer than they thought, and the after-hours response rate is lower. Put those two numbers on the dashboard first. If the after-hours number is the weak one, after-hours lead coverage is the place to start.
Add attribution, MER, handoff measures, and retention one quarter at a time, and run the 90-day export every month.
Frequently asked questions
For a single store starting from scratch, start with the median first-response time on web leads and the first-response rate for leads that arrive after hours. A lead contacted within five minutes is 21 times more likely to qualify than one contacted after thirty minutes, Pied Piper found that 53% of dealer inquiries get no response within 24 hours, and a VisQuanta study of 7,041 dealer leads found that 53% arrived outside business hours.
First-touch attribution gives the credit to the channel that introduced the buyer. Last-touch gives it to the channel just before the conversion. First-touch tends to overvalue awareness channels, and last-touch tends to overvalue retargeting and branded search. Most stores make better spending decisions with a time-decay or position-based model, with the CRM as the source of truth.
MER is total revenue divided by total marketing spend, across all channels, for a set period. It skips the argument about which channel gets the credit and ties marketing to the P&L. It does not tell you which lever to pull, so use MER as the headline number and channel attribution to find the cause when MER moves.
Volume tells you how many buyers entered the funnel. Velocity tells you how fast they move through it. A stage that slows down, such as time to first response, usually shows up later as lower conversion and fewer sales, so velocity gives you an earlier warning than units sold or gross profit.
Buyers use several channels at once, so any single-channel model over-credits one of them. Start with identity resolution in the CRM, so that one buyer’s web visit, ad click, call, text, and showroom visit all land on the same record. With that in place, multi-touch attribution has the data it needs.